Futures Trading Charts: How to Read Them (Without Guessing)
Have you been struggling to read futures trading charts without feeling as though you are staring into an unfamiliar language? Candlesticks, open interest, volume bars and contract months stacked upon each other — it all can seem quite confusing at first! In this guide we break down exactly what it is you are seeing on each of those charts; how best to read and interpret them accurately as well as providing sources for free, reliable charts so that your data requirements won’t increase over time!
Years have gone by where I’ve studied corn and coffee futures charts specifically, partially for work purposes but also out of sheer interest – grain markets tend to move quickly enough that learning patience requires constant vigilance! What follows below are things that would have helped had someone explained them more simply instead of trying to hide things behind jargon.
What Are Futures Trading Charts, Precisely?
A futures trading chart depicts the price of futures contracts over time — these agreements allow traders to purchase or sell assets such as corn, coffee, crude oil or the S&P 500 index at set prices for delivery at future dates at set prices – unlike stock charts which tend to show all available contract months (i.e. corn December 2026 and ZCZ26 etc), futures expire and this often proves challenging when transitioning from stock trading.
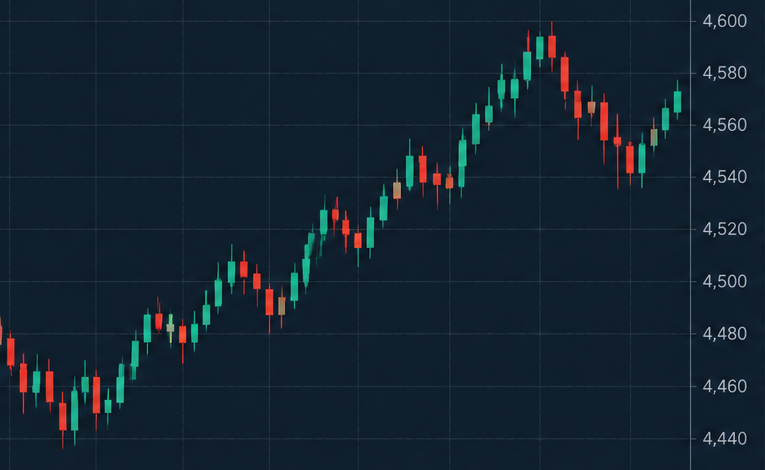
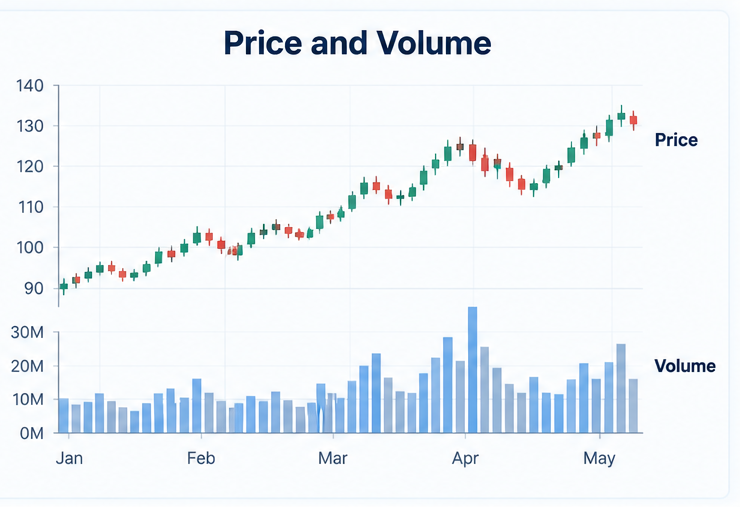
A chart doesn’t need to be complicated: price on one axis and time on another; what makes it effective are all of its additional layers – volume, open interest and patterns that they create.
Candlestick Charts Versus Line and Bar Charts: Which Should You Select?
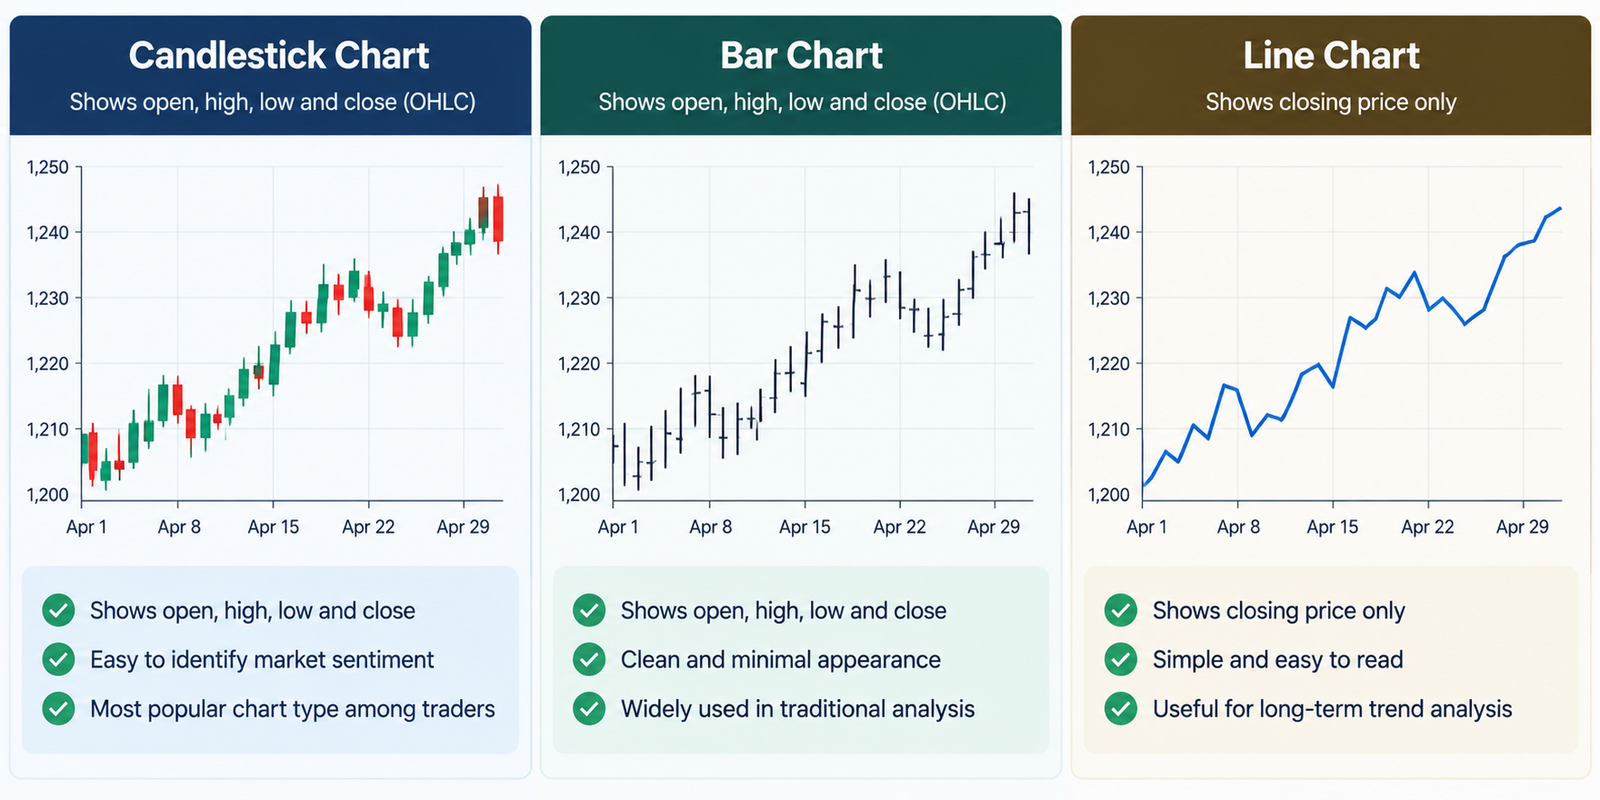
Futures trading chart platforms typically allow traders to switch among three main styles for futures trading charts: candlestick, line and bar.
Line charts – which only display closing prices – are useful, yet lose intraday range information.ot Bar (OHLC) charts display open, high, low, close as tick marks; these have traditionally been employed by some traders on floor floors but may no longer be relevant today. Candlestick charts use similar OHLC data but with color-coding to make patterns easier to detect visually. Candlesticks offer the greatest visual impact when learning futures trading chart patterns; their weighted bodies make momentum changes easily discernible at a glance compared to bar charts which do not.
My transition from bar charts to candlestick charts about eight months into trading corn futures had an immediate and meaningful effect. Something as small as changing charts actually changed how fast I could scan sessions – an impressive turnaround of speed! It made all the difference.
How to Read Futures Trading Chart Step by Step
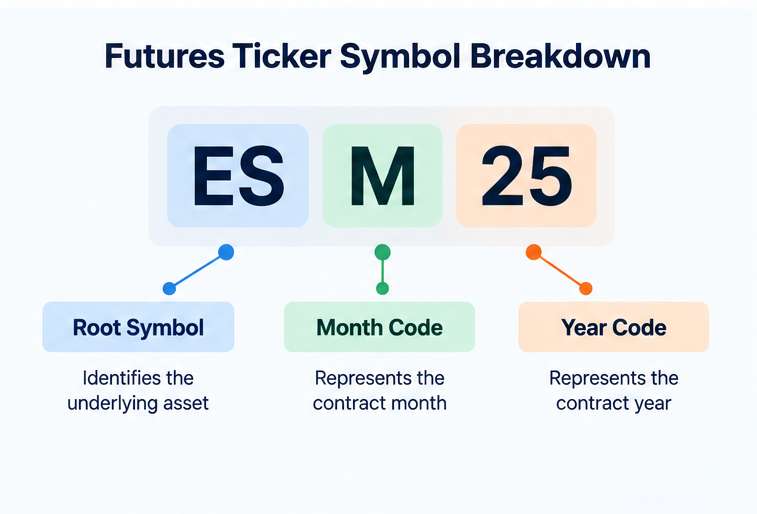
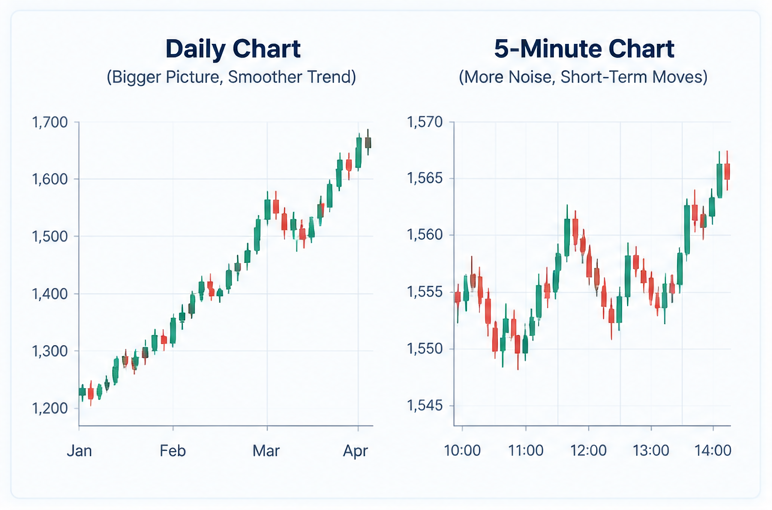
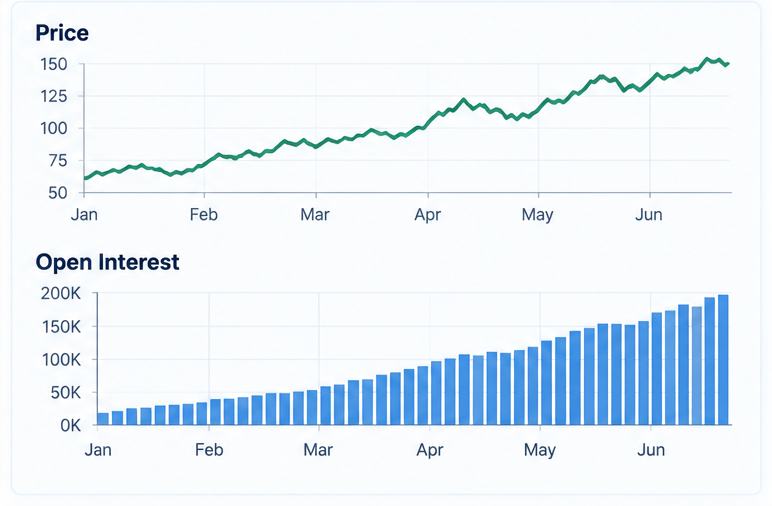
First identify the contract and expiration. Afterward, examine its ticker code for month/year codes such as H=March; K =May; N= July; U = September and Z= December for grains). Set Your Timeframe. Day traders commonly employ 5-minute and 15-minute charts; swing traders prefer daily or weekly charts. Check Volume and Open Interest. Rising open interest with rising price usually signifies a healthy trend while declining open interest can indicate it has lost steam and may indicate something has gone amiss in an investment decision.
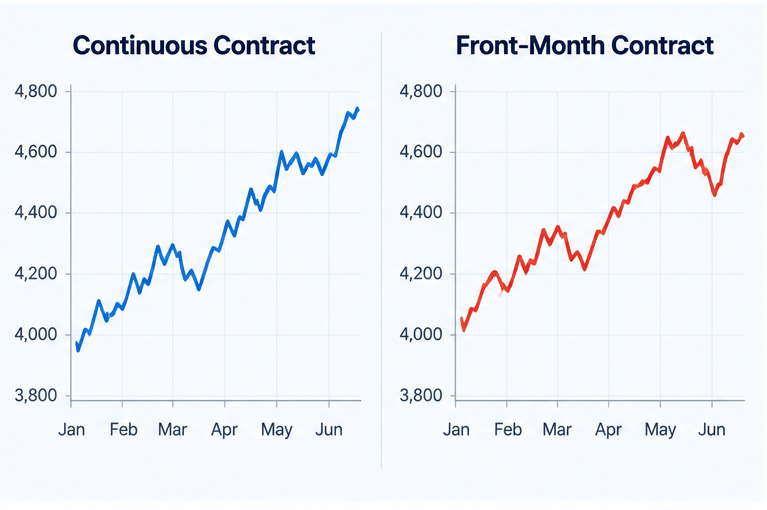
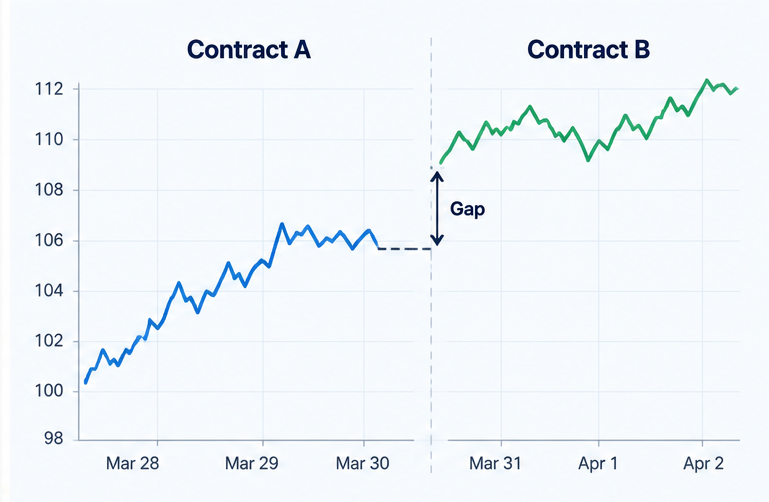
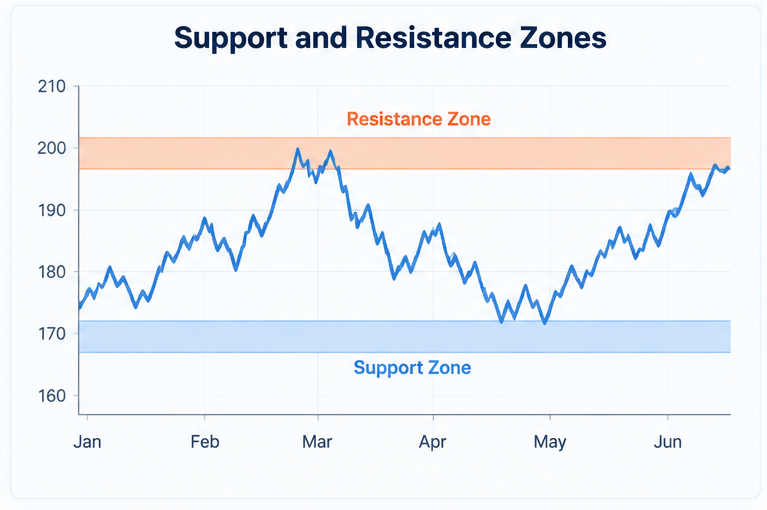
Mark support and resistance. Look for price levels where the market has reversed at least twice before adding one or two indicators such as moving averages or relative strength index (RSI), resisting any temptations to add too many all at once. Be wary of “continuous” charts: as expiration approaches, volume shifts to the following contract month and charts that don’t take into account this process can show unnatural gaps on charts that don’t account for it (continuous charts).
Live Futures Market Charts: What “Live” Means
Unfortunately, free futures trading charts that appear “live” online often lag by 10-15 minutes; this makes an impactful statement when applied to fast-moving markets such as crude oil or the E-mini S&P ETF. Real time data provided through CME or ICE may require either paid subscription fees or funded brokerage accounts – even when using free charting software like Chartist Pro!
Delayed data may be fine when learning, but once placing real orders with delayed charts can cost real money — I know because during an USDA report release, my corn futures trade entered through 15-minute-delayed charts was filled almost 4 cents away than expected, leading to my small account getting filled almost 4 cents below expected price – this experience forced me to change my habits significantly!
Corn Futures Trading Charts: What Makes Them Unique
ZC futures trade on CME/CBOT and are heavily impacted by:
USDA WASDE reports (released every month) are designed to offer planting and harvest progress updates as well as weather patterns across the Midwest during growing seasons. Export Sales Data Corn charts often display sudden spikes on report days and then flatten out over longer stretches, so when charting corn it’s worth marking WASDE release dates directly on your chart — most platforms allow custom event annotations for this feature.
Coffee Futures Trading Charts Reveal Divergent Trends
Coffee futures (KC) traded on ICE are more susceptible than grains to volatility fluctuations that impact other commodities markets such as corn or soy bean futures (KC). Coffee’s susceptibilities to sudden drops include:
Brazil and Vietnam weather (frost risk in Brazil in particular) and currency swings of their reals Shipping and logistics disruptions Coffee charts tend to demonstrate longer, grinding trends punctuated by weather-driven spikes rather than tighter report-driven volatility seen with corn. Common advice recommends trading coffee “like any other commodity chart”, though I suggest going a step further as its correlation to foreign currencies like real means ignoring their chart is missing half the story.
Commodity Trading Charts Vs Futures Stock Charts: Understanding the Difference
Futures stock charts is a commonly searched term but actually encompasses two different things.
Commodity/Futures Charts Stock Charts With one feature per chart type available (commodities/Futures Charts and Stock Charts), physical goods, indices and currencies may all serve as underlyin assets for Company shares (comprising physical commodities, indices and currencies as underlying assets for them respectively); contract expiry (y/n; no contract-based renewal required for contracts in force; contract vs no contract); Leverage typically higher; Lower (standard margin). Trading Hours 24-Hour (Electronic) Trading Limited to Exchange Hours Key Drivers Weather, supply/demand dynamics and geopolitics Earnings and company news When trading futures markets for the first time, one of the main adjustments you might experience will likely be in terms of expiration cycle and trading hours that extend almost around-the-clock trading sessions on some futures markets.
5 Futures Trading Chart Patterns to Know
Head and Shoulders – Reversal pattern with three peaks with the middle one being highest; Flags and Pennants – Reducing volatility after sharp moves often serve as continuation signals; Double Top/Bottoms (Two failed attempts at breaking levels before an eventual turn-around occurs); Ascending/descending triangles — converging trendlines that typically move toward one direction — frequently resolve in favor of flat side trends. Gaps — often seen on Sunday evening electronic sessions at market open despite popular perception. Not all gaps necessarily fill. As nothing works on its own, none of these patterns work by themselves; rather they serve as clues and are never guaranteed wins; any source promising “95% win rate patterns” is selling something.
Futures Trading Charts for Free
Here are several solid, legitimate sources where to secure free futures trading charts:
TradingView — this free tier offers delayed data for most futures symbols with strong charting tools; moreover it features many free delayed quotes for corn, coffee and other agricultural futures futures with free delayed quotes available from Barchart.com; CME Group also provides educational charts as well as settlement data directly through their own site for free use by their traders and clients alike.
Broker platforms — Many futures brokers (AMP, NinjaTrader-connected brokers and so forth) provide real-time charts free of charge once you open an funded account with them. No data package with 200GB worth of data costs $200/month is necessary when beginning out; start free then upgrade as you gain experience and can identify what limitations are holding back your progress.
Beginners May Make Mistakes in Reading Futures Charts
One common error beginners make when reading futures charts is using continuous charts as trade entries without first consulting their individual front month contract, ignoring open interest completely or overdoing it with indicators to the detriment of actual price action itself. Time zones — CME and ICE session times differ significantly, thus changing what “today’s open” signifies; additionally, trading illiquid back-month contracts because front month looked “too expensive”.
Common Questions About Reading Futures Charts
Are free futures trading charts accurate enough for use as trading instruments?
For learning and backtesting strategy ideas, the answer is “yes”. But live execution with delayed data may cause significant gaps to appear between what is seen onscreen and actual fills that occur, particularly around news events.
What’s the optimal timeframe for reading futures charts?
That depends entirely on your trading style — day traders often utilize 5–15 minute charts while swing traders favor daily ones. There is no “best” timeframe – only what best fits with your holding period and investment time horizon.
Why do corn futures charts display gaps between contract months?
Because every month prices in different supply expectations (new crop vs old), continuous charts sometimes display what appears as gaps at their roll dates that don’t represent real price gaps.
Can I trade futures charts using my phone?
Yes – all major charting platforms and broker apps support mobile futures charts; though full indicator customization usually remains easier on desktop.
Do futures charts trade 24 hours a day?
Most electronically traded futures contracts (CME and ICE) run nearly 24 hours on weekdays with just short maintenance breaks on weekends; unlike stock markets that operate between specific hours.
Technical analysis on futures charts is only one tool among several available for evaluation of potential investments, but combined with fundamental analysis (like USDA reports or weather), chart patterns may help with timing but they won’t eliminate risk altogether.
This article should only be read as educational and should not be taken as financial advice. Futures trading entails significant risk, so before trading consult a licensed financial professional.